Insights, Connect, and … Brains?
Welcome to the second and final installment of our CareKit Tutorial series. Now with more zombies!
In Part 1, you learned that CareKit primarily consists of four UI modules and a persistence store. You built an app called ZombieKit and implemented the Care Plan Store, a Care Card and a Symptom and Measurement Tracker.
In this second half of the CareKit tutorial, you’ll build on ZombieKit by implementing the last two UI modules:
- Insights will be used to visualize patterns in the data collected by the Care Card and the Symptom and Measurement Tracker.
- Connect will allow you to display contacts involved in the user’s care plan and share data with them.
Insights will require lots of asynchronous calls to read from the Care Plan Store. If you don’t have much experience with multithreading, Grand Central Dispatch and especially Dispatch Groups, consider reading Grand Central Dispatch Tutorial Part 1 and Part 2 before proceeding.
You’ll pick up exactly where you left off, so open up your completed project from Part 1, or download the Part 1 final project.
Note: If you download the final project, you’ll optionally need to enable HealthKit, because access to your development account is required for that. Follow the instructions under HealthKit Integration in Part 1.
Time to re-join the fray and try to code away the zombie epidemic!
Insights
In Part 1, you learned that OCKCarePlanActivity is the primary model object in the Care Plan Store, representing user activities and everything needed to display them. Each occurrence of an activity is defined by an OCKCarePlanEvent, and data are persisted to the Care Plan Store as events are completed.
Insights help the user make conclusions from the data. Two output formats are supported:
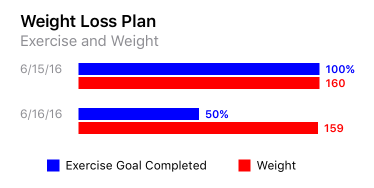
- Charts: CareKit currently only supports bar charts, which can be grouped for comparing data and visualizing patterns. In a weight-loss app, you’d likely chart adherence to exercise goals against weight to visualize the correlation over time.
![CareKit tutorial]()
- Messages: These are simple views with a title and some detail text that come as either tips or alerts. The only difference between the types is the appearance of the icon by the message title. For the weight-loss app, you might include an alert informing the user if they are missing their goal.
![CareKit tutorial]()

Insights reads from Intervention and Assessment activities in the store. However, while it’s designed to work with CareKit, Insights can display any data you like.

Insights View Controller
Users of ZombieKit should be able to track their training adherence against their vital signs to judge how successful their care plan is. You’ll start by getting the Insights controller going with something simple.
Create a new file named OCKInsightItem.swift in the Utilities group. Replace the template code with the following:
import CareKit extension OCKInsightItem { static func emptyInsightsMessage() -> OCKInsightItem { let text = "You haven't entered any data, or reports are in process. (Or you're a zombie?)" return OCKMessageItem(title: "No Insights", text: text, tintColor: UIColor.darkOrange(), messageType: .tip) } } |
You’ve extended OCKInsightItem, the base class from which message and chart insights inherit. emptyInsightsMessage() creates and returns an OCKMessageItem. It includes a placeholder title and message and uses a tip messageType, which places a tinted asterisk by the title.
Open TabBarViewController.swift and add the following to the properties in TabBarViewController:
fileprivate var insightsViewController: OCKInsightsViewController? = nil |
OCKInsightsViewController is the main controller for Insights, and you’ll reference it throughout this file.
In createInsightsStack(), replace:
let viewController = UIViewController() |
with:
let viewController = OCKInsightsViewController(insightItems: [OCKInsightItem.emptyInsightsMessage()], headerTitle: "Zombie Check", headerSubtitle: "") insightsViewController = viewController |
The initializer for OCKInsightsViewController requires an array of OCKInsightItem objects, so you wrap the result of OCKInsightItem.emptyInsightsMessage() in an array. You also provide a headerTitle to appear at the top of the Insight view. Finally, you save a reference to the controller in insightsViewController for later use.
Build and run, then check out the Insights tab to see the header text and your placeholder tip.

Contrary to the name, this isn’t all that insightful yet. It’s time to get your survivor’s data in here!
Completion Data
To generate meaningful insight items, you’ll gather and process data from the Care Plan Store. Start by calculating what percentage of the training plan was completed each day.
Create a new file named InsightsDataManager.swift in the Care Plan Store group. Replace the template code with:
import CareKit class InsightsDataManager { let store = CarePlanStoreManager.sharedCarePlanStoreManager.store var completionData = [(dateComponent: DateComponents, value: Double)]() let gatherDataGroup = DispatchGroup() } |
InsightsDataManager is responsible for pulling data from the Care Plan Store and generating insights from it. You’ve defined the following properties:
- store references your Care Plan Store.
- completionData is an array of tuples tying a date to its corresponding intervention completion value.
- gatherDataGroup is a dispatch group you’ll use to control the order in which several asynchronous operations complete during data processing.
Next, add the following method:
func fetchDailyCompletion(startDate: DateComponents, endDate: DateComponents) { // 1 gatherDataGroup.enter() // 2 store.dailyCompletionStatus( with: .intervention, startDate: startDate, endDate: endDate, // 3 handler: { (dateComponents, completed, total) in let percentComplete = Double(completed) / Double(total) self.completionData.append((dateComponents, percentComplete)) }, // 4 completion: { (success, error) in guard success else { fatalError(error!.localizedDescription) } self.gatherDataGroup.leave() }) } |
This calculates the percentage of Intervention events completed for each day in the specified date range.
- Before kicking off the query, you enter the
gatherDataGroupdispatch group. Later in this tutorial, you’ll add additional queries that will occur concurrently with this one—the group allows you to track when they all complete. - You have the Care Plan Store method
dailyCompletionStatus(with:startDate:endDate:handler:completion:)query allinterventionactivities in the date range for completion data. - The
handlerclosure is called once for each day in the range, and is passed several pieces of information pertaining to that day:dateComponentshas the date,completedis a count of events that were completed on that date andtotalis a count of events in any state. From this, you calculate the daily completion percentage and save it with the date incompletionData. - The
completionclosure is called after all days in the range return. You halt execution in the case of a failure. On success, you leave thegatherDataGroupwhich will later clear the way for insight creation to proceed.
To control the flow of data collection through insight creation, add the following to InsightsDataManager:
func updateInsights(_ completion: ((Bool, [OCKInsightItem]?) -> Void)?) { guard let completion = completion else { return } // 1 DispatchQueue.global(qos: DispatchQoS.QoSClass.default).async { // 2 let startDateComponents = DateComponents.firstDateOfCurrentWeek let endDateComponents = Calendar.current.dateComponents([.day, .month, .year], from: Date()) //TODO: fetch assessment data self.fetchDailyCompletion(startDate: startDateComponents, endDate: endDateComponents) // 3 self.gatherDataGroup.notify(queue: DispatchQueue.main, execute: { print("completion data: \(self.completionData)") completion(false, nil) }) } } |
This will be used as an interface to kick off Insight data operations, and includes a closure that accepts an array of OCKInsightItems.
- Because this method will kick off asynchronous database calls and do computations on the results, it needs to happen on a background queue.
- You call
fetchDailyCompletion(startDate:endDate:)with the start date of the current week and the current date. This will populatecompletionDatawith the results. notify(queue:execute:)defines a completion closure that will run on the main queue when all operations running undergatherDataGroupcomplete. This means it will fire when the completion data has been fetched and processed. In the closure, you temporarily print the fetched data and passnildata to the completion—you’ll replace this later.
In Part 1, you created CarePlanStoreManager to handle Care Plan Store operations; this is where you’ll create an interface to the InsightsDataManager. Open CarePlanStoreManager.swift and add the following to CarePlanStoreManager:
func updateInsights() { InsightsDataManager().updateInsights { (success, insightItems) in guard let insightItems = insightItems, success else { return } //TODO: pass insightItems to the insights controller } } |
This calls updateInsights(_:) in the InsightsDataManager and applies a guard in the completion closure to unwrap the results when successful. Later, you’ll pass these to the Insights controller for display.
To ensure insights are ready when the user pulls them up, you refresh them every time the store is updated. Add the following to the bottom of the file:
// MARK: - OCKCarePlanStoreDelegate extension CarePlanStoreManager: OCKCarePlanStoreDelegate { func carePlanStore(_ store: OCKCarePlanStore, didReceiveUpdateOf event: OCKCarePlanEvent) { updateInsights() } } |
You’ve implemented a delegate method that the OCKCarePlanStore calls whenever an event is updated. You use it to keep Insights updated via updateInsights().
Go to init() in CarePlanStoreManager and add this line just below super.init():
store.delegate = self |
CarePlanStoreManager is now the store’s delegate, so your new extension method will trigger.
Take a deep breath (assuming you’re still among the living). It wasn’t easy, but you’ve got all the bones here to start cranking out Insights!
Build and run, then tap on some training events in Zombie Training or complete an activity in the Symptom Tracker. Watch the console—you’ll see updated completionData from your logging. This means you’ve successfully received notifications of event updates, queried the events and calculated completion percentages.
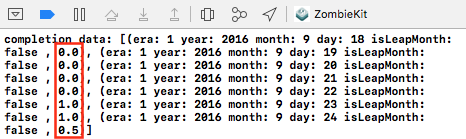
Completion percentage in Double format
Now that you have completion data by date, it’s time to pretty it up a bit in chart form!
Completion Bar Chart
Like its message item counterpart, OCKBarChart inherits from OCKInsightItem. For each bar it displays, it requires an OCKBarSeries to provide values and labels.
Open InsightsDataManager.swift and add the following computed property to InsightsDataManager:
var completionSeries: OCKBarSeries { // 1 let completionValues = completionData.map({ NSNumber(value:$0.value) }) // 2 let completionValueLabels = completionValues .map({ NumberFormatter.localizedString(from: $0, number: .percent)}) // 3 return OCKBarSeries( title: "Zombie Training", values: completionValues, valueLabels: completionValueLabels, tintColor: UIColor.darkOrange()) } |
This creates a series for completion data.
- You extract the
valueproperty fromcompletionDataand store it as an NSNumber incompletionValues. - You use
localizedString(from:number:)to create an array of strings in percent format to be used as labels on the chart. - You create and return the
OCKBarSeriesusing the above values and labels, also passing a title and tint color to be used on the chart.
With the series ready to go, create the bar chart. Add the following to InsightsDataManager:
func produceInsightsForAdherence() -> [OCKInsightItem] { // 1 let dateStrings = completionData.map({(entry) -> String in guard let date = Calendar.current.date(from: entry.dateComponent) else { return "" } return DateFormatter.localizedString(from: date, dateStyle: .short, timeStyle: .none) }) //TODO: Build assessment series // 2 let chart = OCKBarChart( title: "Zombie Training Plan", text: "Training Compliance and Zombie Risks", tintColor: UIColor.green, axisTitles: dateStrings, axisSubtitles: nil, dataSeries: [completionSeries]) return [chart] } |
- You map the
DateComponentsincompletionDatato formatted strings. You’ll use these as axis titles as you display a series of bars for each date. - You create the
OCKBarChartusing the abovedateStringsas axis titles and thecompletionSeriesof completion percentages as the sole data source. As you can see, it will be easy to later add additionalOCKBarSerieshere to compare multiple datasets.
Now that you have some Insights, you just have to get them up to the OCKInsightsViewController for display. Start by going to updateInsights(_:) and replacing:
print("completion data: \(self.completionData)") completion(false, nil) |
with:
let insightItems = self.produceInsightsForAdherence() completion(true, insightItems) |
This creates your Insight items and passes them up to the caller’s completion closure. Follow it to CarePlanStoreManager.swift and find where updateInsights() implements this closure. You don’t yet have a hook into the Insights controller, so you’ll need to create a way to get it there before adding anything here.
It wouldn’t be good practice for the store manager to maintain a reference to one of your controllers. Instead, you’ll create a protocol that can be used to delegate insight updates. Add the following definition just above CarePlanStoreManager:
protocol CarePlanStoreManagerDelegate: class { func carePlanStore(_: OCKCarePlanStore, didUpdateInsights insights: [OCKInsightItem]) } |
The protocol defines a single method that will pass along an array of OCKInsightItem objects.
Add a property to the top of CarePlanStoreManager:
weak var delegate: CarePlanStoreManagerDelegate? |
This allows you to assign a delegate that adopts your new protocol.
In updateInsights(), replace //TODO: pass insightItems to the insights controller with:
self.delegate?.carePlanStore(self.store, didUpdateInsights: insightItems) |
This calls the delegate, passing the insightItems provided by the InsightsDataManager.
To make sure someone’s listening, go to TabBarViewController.swift and add the following extension to the file:
// MARK: - CarePlanStoreManagerDelegate extension TabBarViewController: CarePlanStoreManagerDelegate { func carePlanStore(_ store: OCKCarePlanStore, didUpdateInsights insights: [OCKInsightItem]) { insightsViewController?.items = insights } } |
TabBarViewController now adopts the new protocol and implements carePlanStore(_:didUpdateInsights:). Setting items on an Insights controller causes it to automatically refresh with that data. Here, you’ve set it to the value passed over by the CarePlanStoreManager.
Go to init(coder:) and add the following just below the call to super.init(coder:):
carePlanStoreManager.delegate = self carePlanStoreManager.updateInsights() |
TabBarViewController is now the CarePlanStoreManagerDelegate, ready to be notified when new insights arrive. You also call updateInsights() directly here to ensure insights are ready at launch, even if no updates have occurred.
Build and run, then complete some items in Zombie Training. Unless it’s the first day of the week, use the date selector header to jump to earlier dates and complete some there too. Check the Insights tab, and you’ll see a bar chart representing the completion data you’ve generated this week!

That was a lot of work, but now that you have the architecture in place, adding additional insights just requires packaging up their data.

Assessment Bar Chart
Seeing the daily adherence percentage only tells part of the story. If you could view them alongside collected pulse and temperature assessments, you might be able to tell a full story. Possibly a horror story!
To obtain pulse and temperature values for each day, you need to fetch the associated activities. Open InsightsDataManager.swift and add the following method to InsightsDataManager:
func findActivityWith(_ activityIdentifier: ActivityIdentifier) -> OCKCarePlanActivity? { let semaphore = DispatchSemaphore(value: 0) var activity: OCKCarePlanActivity? DispatchQueue.main.async { self.store.activity(forIdentifier: activityIdentifier.rawValue) { success, foundActivity, error in activity = foundActivity semaphore.signal() } } let _ = semaphore.wait(timeout: DispatchTime.distantFuture) return activity } |
You use a semaphore and semaphore.wait in this method to effectively make it run synchronously. This is because you’ll eventually call it on a background thread that requires it to return an activity before moving on.
Beyond that, it simply calls activity(forIdentifier:completion:) which will query the store for an activity with the passed identifier.
Note: You call activity(forIdentifier:completion:) on the main queue due to a bug that results in a crash if run elsewhere. Apple references a radar that exists for this in their sample CareKit application.
Remember that the results of interventions and assessments don’t reside in the activity itself, but rather in the events associated with it. You need to write some code to read through the events for an activity and pull out results, so add the following method to the same class:
func fetchActivityResultsFor(_ activity: OCKCarePlanActivity, startDate: DateComponents, endDate: DateComponents, completionClosure: @escaping (_ fetchedData: [DateComponents: Double]) ->()) { var fetchedData = [DateComponents: Double]() // 1 self.gatherDataGroup.enter() // 2 store.enumerateEvents( of: activity, startDate: startDate, endDate: endDate, // 3 handler: { (event, stop) in if let event = event, let result = event.result, let value = Double(result.valueString) { fetchedData[event.date] = value } }, // 4 completion: { (success, error) in guard success else { fatalError(error!.localizedDescription) } completionClosure(fetchedData) self.gatherDataGroup.leave() }) } |
This method will pull result data for the passed activity. It takes a completionClosure to simplify getting the returned data back to the caller asynchronously. You’ll see this work shortly.
- As you did with the percentage complete, you’re using the
gatherDataGroupdispatch group to hold off the creation ofOCKInsightItemobjects until all data has been fetched. enumerateEvents(of:startDate:endDate:handler:completion:)is similar to the method used for completion data, except that it’s looking more generically at each event for a givenactivity.- For each event, you store the
resultinfetchedDatawith the event date as key. Note that in ZombieKit you only scheduled one assessment per type each day, and this implementation isn’t built to handle more. - You fail in the case of an error, then call the
completionClosurewith the data fetched for each day. Finally, you notifygatherDataGroupthat your work is done.
Next, add two properties to the top of this class:
var pulseData = [DateComponents: Double]() var temperatureData = [DateComponents: Double]() |
You’ll use these dictionaries to store your pulse and temperature data.
In updateInsights(_:), replace //TODO: fetch assessment data with:
guard let pulseActivity = self.findActivityWith(ActivityIdentifier.pulse) else { return } self.fetchActivityResultsFor(pulseActivity, startDate: startDateComponents, endDate: endDateComponents) { (fetchedData) in self.pulseData = fetchedData } guard let temperatureActivity = self.findActivityWith(ActivityIdentifier.temperature) else { return } self.fetchActivityResultsFor(temperatureActivity, startDate: startDateComponents, endDate: endDateComponents) { (fetchedData) in self.temperatureData = fetchedData } |
Here you grab both activities using findActivityWith(), then fetch the associated assessment data via fetchActivityResultsFor(_:startDate:endDate:completionClosure:). In the completion closures, you save the fetched data in pulseData and temperatureData.
Now you have the data to create an OCKBarSeries for each activity. Create the following method to do just that:
func barSeriesFor(data: [DateComponents: Double], title: String, tintColor: UIColor) -> OCKBarSeries { // 1 let rawValues = completionData.map({ (entry) -> Double? in return data[entry.dateComponent] }) // 2 let values = DataHelpers().normalize(rawValues) // 3 let valueLabels = rawValues.map({ (value) -> String in guard let value = value else { return "N/A" } return NumberFormatter.localizedString(from: NSNumber(value:value), number: .decimal) }) // 4 return OCKBarSeries( title: title, values: values, valueLabels: valueLabels, tintColor: tintColor) } |
Going through this:
- For each date in
completionData, which covers the range being mapped, you extract the corresponding value from the passeddataarray. normalizeis a method packaged with the starter project. This will normalize a dataset such that the highest value is 1.0 and lowest is 0.0. The values are also unwrapped and nils replaced with 0.0. With this, all of your bars plot on the same relative scale.- This creates the labels for your bar, replacing nil values with
"N/A"and displaying others in decimal format. - An
OCKBarSeriesis created using the passed title and tintColor as well as the values and labels you just derived.
Return to produceInsightsForAdherence(), where you earlier converted the percentage OCKBarSeries into a chart. Replace //TODO: Build assessment series with the following:
let pulseAssessmentSeries = barSeriesFor(data: pulseData, title: "Pulse", tintColor: UIColor.darkGreen()) let temperatureAssessmentSeries = barSeriesFor(data: temperatureData, title: "Temperature", tintColor: UIColor.darkYellow()) |
This creates two OCKBarSeries you can use in the chart for the pulse and temperature. Add these to the array passed in the dataSeries parameter in the OCKBarChart initialization, so it looks like this:
[completionSeries, temperatureAssessmentSeries, pulseAssessmentSeries] |
Build and run, make sure you’ve filled out some assessments and intervention activities, and head to the Insights tab. You’ll see something like this:

It took some effort, but now you have great visual insights that update automatically as events complete. It’s just too bad your survivor didn’t put as much effort into his or her training. Looking at the chart, I’d say the infection started late on the 13th. :]
Connect
The final UI module in our series is Connect, which allows you to contact your friends, supporters and care team about your health. You’re even able to share things like the bar chart you just created directly with your team.
OCKContact is the model class used for contacts. As you may recall, it doesn’t reside in the Care Plan Store.
For simplicity, you’ll add it to your CarePlanData class where all of the other data for this app is seeded. Open CarePlanData.swift and paste the following at the bottom of CarePlanData‘s existing properties:
let contacts = [OCKContact(contactType: .personal, name: "Shaun Riley", relation: "Friend", tintColor: nil, phoneNumber: CNPhoneNumber(stringValue: "888-555-5512"), messageNumber: CNPhoneNumber(stringValue: "888-555-5512"), emailAddress: "shaunofthedead@example.com", monogram: "SR", image: UIImage(named: "shaun-avatar")), OCKContact(contactType: .careTeam, name: "Columbus Ohio", relation: "Therapist", tintColor: nil, phoneNumber: CNPhoneNumber(stringValue: "888-555-5235"), messageNumber: CNPhoneNumber(stringValue: "888-555-5235"), emailAddress: "columbus@example.com", monogram: "CO", image: UIImage(named: "columbus-avatar")), OCKContact(contactType: .careTeam, name: "Dr Hershel Greene", relation: "Veterinarian", tintColor: nil, phoneNumber: CNPhoneNumber(stringValue: "888-555-2351"), messageNumber: CNPhoneNumber(stringValue: "888-555-2351"), emailAddress: "dr.hershel@example.com", monogram: "HG", image: UIImage(named: "hershel-avatar"))] |
Most of these are self-explanatory for a contact. A few things to note:
- contactType: Takes a value from the
OCKContactTypeenum that identifies someone as apersonalorcareTeamcontact for display grouping. - relation: A string used to identify the user’s relation to the contact.
- monogram: The contact’s initials, to be displayed in place of an avatar if no image is provided.
- image: An image used as an avatar on both a summary cell and detail view. The starter project included some zombified contacts in Assets.xcassets for use here.
Head back to TabBarViewController.swift and find createConnectStack(). Replace:
let viewController = UIViewController() |
with:
let viewController = OCKConnectViewController(contacts: carePlanData.contacts) |
This allocates a OCKConnectViewController and passes it the array of contacts you just defined.
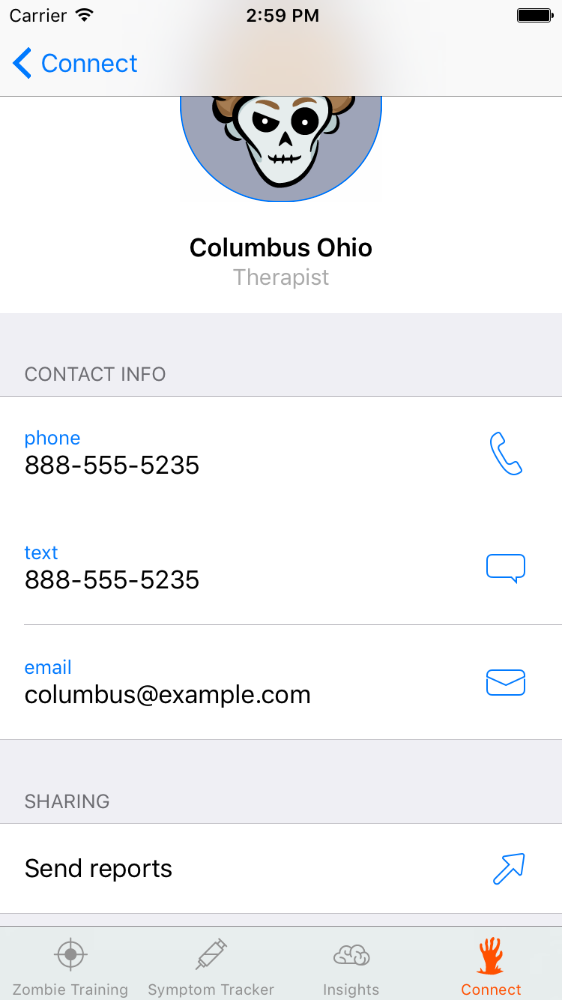
Build and run, then check out the Connect tab. You can see all of your contacts grouped by type, and you’ll be able to drill through to details. On the detail view you can email, call or text depending on your device capabilities.
The real power of Connect is the ability to share your data with contacts. For instance, it would be great to share the chart you created with Dr. Hershel Greene for some clinical feedback.
First, cache the most current OCKBarChart created for Insights. Still in TabBarViewController, add the following property with the others up top:
fileprivate var insightChart: OCKBarChart? = nil |
You’ll use this to hang onto the chart. Go to your CarePlanStoreManagerDelegate extension and add the following to the top of carePlanStore(_:didUpdateInsights:):
if let trainingPlan = (insights.filter { $0.title == "Zombie Training Plan" }.first) { insightChart = trainingPlan as? OCKBarChart } |
This filters your OCKInsightItem array by title in a lightweight attempt to identify the chart. Because there should be only one, you grab the first, cast it and point your property to it.
You need to put the chart into an OCKDocument before it can be shared. Open CarePlanData.swift and add the following extension to the bottom of the file:
extension CarePlanData { func generateDocumentWith(chart: OCKChart?) -> OCKDocument { let intro = OCKDocumentElementParagraph(content: "I've been tracking my efforts to avoid becoming a Zombie with ZombieKit. Please check the attached report to see if you're safe around me.") var documentElements: [OCKDocumentElement] = [intro] if let chart = chart { documentElements.append(OCKDocumentElementChart(chart: chart)) } let document = OCKDocument(title: "Re: Your Brains", elements: documentElements) document.pageHeader = "ZombieKit: Weekly Report" return document } } |
documentElements is an array of OCKDocumentElement objects, which all components of an OCKDocument must be. You initialze the array with an OCKDocumentElementParagraph containing some introductory text, then add an OCKDocumentElementChart with the passed chart. This is used to create an OCKDocument that also has a title and page header.
Open TabBarViewController.swift and add the following extension to the bottom of the file:
// MARK: - OCKConnectViewControllerDelegate extension TabBarViewController: OCKConnectViewControllerDelegate { func connectViewController(_ connectViewController: OCKConnectViewController, didSelectShareButtonFor contact: OCKContact, presentationSourceView sourceView: UIView) { let document = carePlanData.generateDocumentWith(chart: insightChart) let activityViewController = UIActivityViewController(activityItems: [document.htmlContent], applicationActivities: nil) present(activityViewController, animated: true, completion: nil) } } |
Here you create a UIActivityViewController, pass it an HTML version of your latest insight bar chart and present it.
The presence of a delegate conforming to OCKConnectViewControllerDelegate causes a cell to appear on the contact detail screen called Send reports. When this cell is selected, connectViewController(_:didSelectShareButtonFor:presentationSourceView:) will be called.
To connect the delegate, go to createConnectStack() and add the following just below where your OCKConnectViewController is allocated.
viewController.delegate = self |
Build and run. In the Connect tab, select a contact and then the Send reports cell at the bottom.
Doing so creates an activity sheet that will send your document to the selected service. Select Mail, and you’ll see your report in the email body!

Note: There is currently an issue in iOS 10 impacting rendering of the OCKBarChart—it may turn up completely blank. An issue is open for this in the CareKit repository, and this tutorial will be updated when resolved. The above screenshot was generated on an iOS 9 device.
Where to Go From Here?
Download the final project for this CareKit tutorial series here. If you want to enable HealthKit, remember to follow the HealthKit Integration instructions in part one.
For a deeper dive into the framework, check out Apple’s official CareKit documentation as well as the API Reference. You can also keep on top of the latest changes to the framework, and even contribute some of your own, on GitHub.
We hope you enjoyed this CareKit tutorial series and have a good grasp on what CareKit can do. Apple has provided the hardware and software to do amazing things for personal health, but it’s up to people like you to employ them to help others stay healthy and non-zombiefied. Please join the discussion about this CareKit tutorial series, CareKit, and your plans to improve lives below!
The post CareKit Tutorial for iOS: Part 2 appeared first on Ray Wenderlich.


