 Mobile analytics is one of those buzzwords that everyone seems to be talking about, but the definition of that can be kind of nebulous. What is mobile analytics, anyway?
Essentially, mobile analytics is a three-step process:
- Collecting data from your app.
- Analyzing the data to find out how users work with your app.
- Using that data to make business decisions about your app and its future development.
In this article, I’ll cover why you should add mobile analytics into to your app, and share some real-world, surprising insights I’ve gained from using analytics over the years.
Once you’re convinced of the benefits of mobile analytics, I’ll help you get started by sharing my three favorite mobile analytics platforms (and one honorable mention) and show you the pros and cons of each.
Let’s get analyzing!
Why Mobile Analytics?
Not using analytics in your app? You’re really putting yourself at a disadvantage.
Analytics can help you make data-driven decisions based on numbers — instead of making qualitative judgments based on speculation and best guesses. A scientific approach to planning your app’s future will helps you focus your limited development resources on the conversion strategies and features that resonate most with your users.
Specifically, analytics can help you discover which parts of your app people use, and more importantly, which parts they don’t. They can also tell you which features drive conversions, and can even tell you if people even use your app — something straight download stats can’t tell you.
Let me illustrate the usefulness of analytics with a few examples from my own work.
Analytics Example 1: Venmo
At Venmo, we used mobile analytics with the primary goal of growing our user base. We were hoping to improve signup conversion after users had downloaded the app. We tested two different landing pages:
- A feed view that displayed a social feed, but didn’t explain the app
- A static page that displayed an explanation of how the app worked

On the left, the feed view; on the right, the static page.
Which version is better? Without analytics, your guess is as good as mine.
However, by adding analytics into the app, we had definitive proof. The feed view on the left actually performed 20% better!

Not exact data, but illustrates the point!
We found this a bit odd, considering the new page didn’t explain the app at all. That’s the magic of analytics, though: sometimes your insights can be counterintuitive.
Analytics Example 2: Steps
In my own app Steps, I developed a social feature that let users compete with friends:

I was inclined to further build out the social features, but once I looked at the data, I realized that most users weren’t engaging with the newly-built features:

Only 153 out of 12,517 (1.22%) of users logged in.
I realized I was working on a feature that people weren’t really using. Instead of spending time and resources developing the social features, I figured it was more important to introduce the social feature to users first, and focus on developing the feature later.
In general, analytics can help you make the right decision, as opposed to what merely “feels right”.
Conclusions from Examples
I could bombard you with examples, but a super-simple answer to “Why mobile analytics?” is: “Why not?”
Adding mobile analytics to your app is incredibly easy to do. There are many platforms that make it easy to collect and analyze your data; I’ve recommended a few at the end of this article.
Generally, all that’s needed to implement analytics in your app is a few lines of code, like so:
Amplitude.instance().trackingSessionEvents = true Amplitude.instance().initializeApiKey(API_KEY) Amplitude.instance().logEvent(EVENT_NAME, withEventProperties: PROPERTIES) |
It doesn’t take much time, and offers huge benefits. It’s hard to think of a reason why you wouldn’t use analytics.
If you want to get the benefits of analytics, remember to set time aside on your schedule to complete the second two steps: analyzing the data, and using that data, like the above examples demonstrated.
Which Analytics to Collect?
There are two main types of data you should collect: basic usage data and custom events.
Basic Data
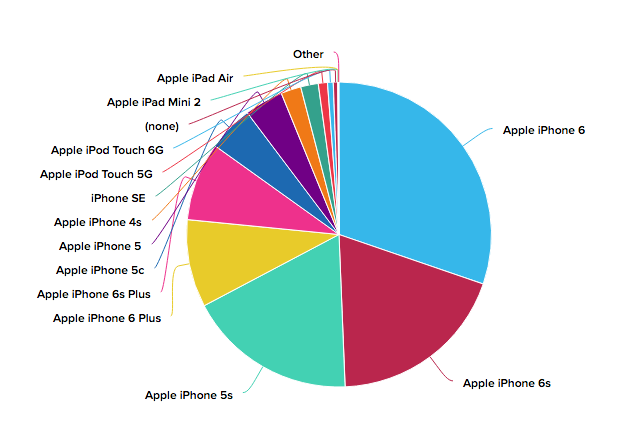
First off, there are some valuable, high-level pieces of data every app should collect, such as OS version, device information and language:
-
OS Version: If you can measure that 98% of your users are on iOS 9, and you want to adopt newer iOS features, or simply make your life easier and drop support for iOS 8, then you can feel confident in your decision. The opposite is also true: If most of your users are still on iOS 8, then it probably makes sense to continue to support for older iOS versions.

- Language: This tells you the language of the device as set in Settings. This, along with device location, can help you decide which languages you should target for localization.

- Device Information: This can help you determine what hardware features are available. If a lot of your users are on an iPhone 5 without a Co-Motion processor, it may be difficult to implement some Core Motion features.

Custom Events
Custom events are probably where you’ll spend your most time. By adding custom events, you can gain valuable insights particular to your app.
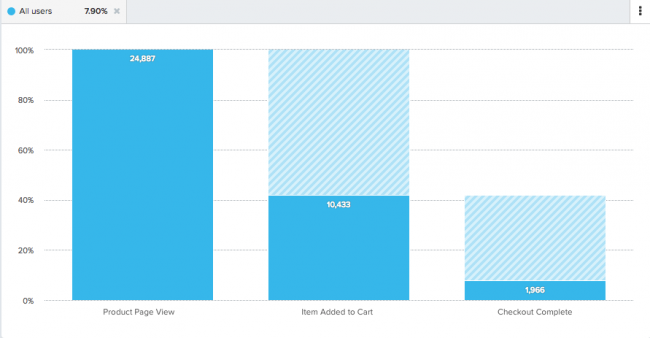
For example, a shopping app like Amazon may have an “Item Added to Cart” event and a “Checkout Completed” event triggered through code like the following:
Amplitude.instance().logEvent("Item Added to Cart") |
You can also attach key-value attributes to these events through event properties. If a user has selected “Electronics” as his or her favorite shopping category, you might want to add a "favorite category": "electronics" property to the “Item Added To Cart” event with code similar to this:
Amplitude.instance().logEvent("Item Added To Cart", withEventProperties: ["favorite category": "electronics"]) |
You might think you should add a custom event for every feature and action in your app, then sift through the data to find actionable insights. After all, the more data the better, right?
But the issue is that too many data points and events can cloud the insights of your app, since you’re spreading your focus across too many disparate statistics.
Instead, focus on core actions of your app or funnels you would like to optimize.
A funnel is a series of events you can analyze to determine the percentage of users that go on to complete the series. For instance, you may want to determine how many users that reach the “Item Added to Cart” event eventually get to the “Checkout Completed” event. Though this is a simple two-step funnel, you can create funnels that contain many events.

One of the best starting points for custom events is to identify your optimization goals. Take the above example of the shopping cart. One way to improve this goal is to test the hypothesis that higher-rated products yield to a higher checkout rating. For this, you would create a funnel from “Item Added to Cart” to “Checkout Completed”.
You’d then add a “Number of Stars” event property to the “Item Added to Cart” event and filter the funnel by “Number of Stars”. This would let you analyze the difference in conversion rate between adding 3 star items vs. 5 star items to the cart.

Conversion rate of adding 3 star items vs 5 star items to the cart.
You might find that items with 5 stars are three times more likely to checkout than products with other ratings — perhaps because users have confidence in the product. Knowing this, think about what you could change in your checkout process. For example, you may want to give more weight to higher product ratings when surfacing the product search results.
Custom Events Example 1: Venmo
At Venmo, referral invites was one of the key drivers of growth. In our original app design, we had a screen that let users select whether they wanted to send email or SMS invites prior to showing the user a list of contacts to invite.

After adding custom events for each part of the invite flow to the app, we quickly realized that most users skipped invitations altogether because of this intermediary screen. So we tried removing the screen and taking the users straight to a list of contacts, and saw the following results (green being before, orange being after):

You can clearly see the bump in invites!
With the help of custom events, we ultimately increased invites significantly by deleting code!
Adding analytics around key areas that you want to optimize in your app is definitely the correct approach, as opposed to adding analytics everywhere and trying to figure things out as you go along.
Custom Events Example 2: Calm
Another great analytics success story is from the team behind the meditation app Calm, who had a goal of improving user retention.
In other words, they wanted to increase active users, which is the number of distinct users your app has within a specific timeframe.
One feature in Calm an opt-in daily notification to remind users to perform their meditation session. The team wondered if users who opted-in to the daily notification enabled were more likely to return to the app.
So the team added a custom event around the daily reminder feature and created a cohort — a specific subset of users based on some criteria — for users who enabled the daily reminder.
They found that users who had enabled the reminder were at least three times more likely to return to the app!

The blue line shows users with the reminder enabled and the red users without the reminder. These are not exact numbers.
However, the reminder feature was buried deep in the app, so only a small fraction of users actually used this feature:

Buried features seldom get used.
To fix this, the team then added features including a prompt to encourage users to set the reminder, and displayed the prompt after a user had completed their first meditation session. 40% of users who saw the prompt enabled daily reminders.

The prompt that increased retention by 3x.
This led to massive growth in active users – another example of custom events for the win.
Top 3 Mobile Analytic Providers
Now that you’ve hopefully been convinced of the benefits of mobile analytics, let’s discuss which analytic provider to use.
Note that there are many mobile analytics providers that make it easy to collect, aggregate, and analyze data. I would highly recommend using one of these platforms instead of building your own, as in-house analytics tracking can quickly become difficult to manage. In fact, some companies try to do it in-house and later realize it ends up being more cost-effective to go with a third-party solution.
I’ve narrowed my choices down to three options based on the following four factors:
- Features: Features are most important because you want to make sure you’re not losing out on valuable insights.
- Dashboard UI: An easy to use, intuitive dashboard UI not only makes it easy to explore your data, but fun as well. It’s easy to forget about analytics when you are caught up with other aspects of your app.
- Price: The price of some analytics packages can quickly soar with increased usage, which is why it’s important to be mindful of what you track.
- Longevity: Finding an analytics provider with some amount of longevity will pay off in the long run. Choosing an analytics provider that has a big team, with lots of funding and established customers can help protect you against your analytics provider disappearing tomorrow — and losing all your analytic data.
Below are three options I recommend most often — plus one honorable mention!
1. Firebase

Demographics and Interests data from Firebase
The recent re-launch of Firebase makes it seem like Google is trying to merge Google Analytics for Mobile and Firebase. Google has ported most of the core features of GA to Firebase in a more mobile-focused suite.
For example, in-app-purchases are prominent in the default Firebase dashboard. Demographics data is presented in a consolidated, easier to understand manner.
Firebase also has a suite of other features, from a realtime database, to user authentication, to push notifications. Firebase is a great choice, especially if you decide to use the other features it has to offer.
Firebase offers a lot of different analytics out of the box. It gives you high-level demographics data, like gender, location, and even different interest categories for users. It can also tell you the percentage of users on various operating systems or devices. It’s also easy to create segments, track retention, build funnels, and much more.
Overall, Firebase Analytics has many features and is still fairly new. I’m excited to see how it develops further! Firebase Analytics is free, which is a huge plus.
Pros
- Free
- Demographics and Interests Data
- Lots of useful features
Cons
- Can feel feature-bloated
- Fewer enterprise level-features
2. Amplitude

Amplitude is a great mobile analytics package that provides many high-level analytics, but doesn’t have any gender or interests demographics data. Amplitude’s analytics are also real-time, which I like.
Immediately after releasing a new app version in the App Store, it’s possible to see how new features are performing or how various tweaks have improved the app. It’s also great to get a pulse on how many users are using the app on any given day.
Amplitude’s free tier offers 10 million monthly events, which is quite generous. But pricing goes up quickly to $2,000/month, which is definitely a major downside. However, the analytics feature set and generous free package outweigh that.
Pros
- Intuitive user interface
- Robust; analytics is the focus
- Generous free tier
Cons
- Paid tiers can be pricey
- Fewer features beyond mobile analytics
3. Mixpanel

Mixpanel is used by tens of thousands of companies — and for good reason. They provide a full-suite user engagement platform that not only provides analytics, but also offers things like a push notification dashboard, user surveys, and A/B testing.
The data dashboard is fairly easy to use as well, which makes surfacing ideas a breeze However, Mixpanel is quite pricey and the free tier is not as generous as that of Amplitude. If you’re looking for a full-fledged growth platform with a lot of bells and whistles and are willing to pay for it, Mixpanel is a fantastic option.
Pros
- Engagement features such as notifications and user surveys
- Built-in A/B testing
Cons
- Expensive
- Collects less high-level data out of the box
Honorable Mention: AWS Mobile Analytics
I love AWS Mobile Hub, but its mobile analytics offering is a bit bare-bones. The user interface is not as intuitive as the three options above and there aren’t many additional features like demographics or notifications.
That said, Amazon provides a generous free tier — 100 million monthly events — and beyond that the price is almost negligible. If you are familiar with Amazon’s ecosystem or are using AWS Mobile Hub, I would definitely recommend AWS Mobile Analytics.
What About iTunes Connect?
True, iTunes Connect provides some data about your app. There are four components to iTunes Connect App Analytics: Overview, Metrics, Sources, and Retention. Overview gives you a high-level summary of app store statistics like impressions, product page views, downloads, IAP, sales, and so on.

iTunes Connect Analytics “Overview” tab
Metrics lets you compare the various collected statistics. Sources shows you the conversion rate between the different websites and ad campaigns driving traffic to your app in the App Store. Finally, Retention shows the percentage of users that downloaded the app on one day and used the app again at a later date.
Gathering data such as device information and installation base by country can definitely help you better understand your users, and it seems like the new Analytics feature in iTunes Connect may suffice for that purpose.
However, iTunes Connect is quite limited in the kind of data it collects, and since it’s opt-in only it probably doesn’t represent the entire picture. You can check how many users opt-in by clicking the question mark next to About App Analytics Data on the top-right of the Overview tab in App Analytics. I have a measly 28% opt-in rate for my Steps app.
Also, iTunes Connect App Analytics doesn’t allow for custom events, segments, or other advanced features that can give you deep insight into your usage statistics. However, iTunes Connect Analytics is good for determining App Store conversion rate, since no other platform gives you this data.
Where to Go From Here?
At this point, you’ve seen some real-world success stories, and hopefully you’re pumped to add analytics into your apps.
So what are you waiting for? Choose one of the providers above and follow the three simple steps:
- Collect data from your app.
- Analyze the data to find out how users work with your app.
- Use that data to make business decisions about your app and its future development.
If you’re looking for somewhere to start, focus on signup and onboarding to begin. Optimizing either of these can lead to increased retention, since each is at the top of the funnel.
I wish you all the best! If you have any comments or questions, come join the discussion below.
The post Getting Started with Mobile Analytics appeared first on Ray Wenderlich.